Introduction
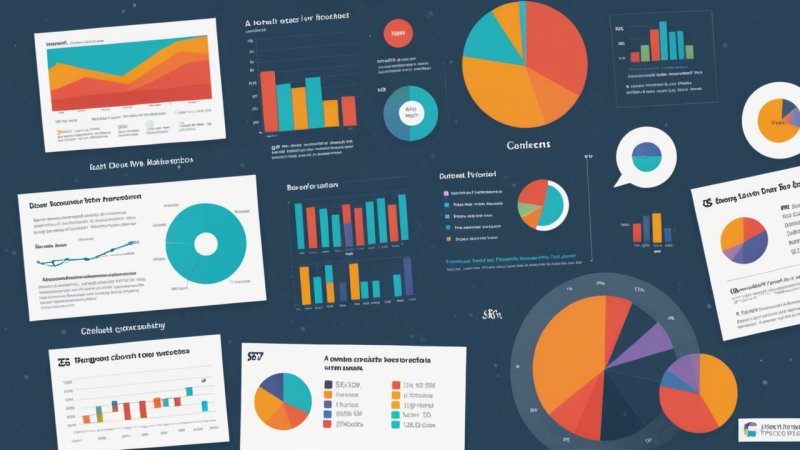
In the age of information overload, the way we present data can significantly impact how research findings are interpreted and understood. Data visualization plays a crucial role in transforming complex datasets into accessible formats that are easier to comprehend. Here, we explore the top five reasons why data visualization is essential for presenting research findings.
1. Enhances Understanding
Data visualization simplifies complex information, making it easier for audiences to grasp key concepts. By using visual elements such as charts, graphs, and infographics, researchers can highlight important trends and patterns that might be overlooked in raw data.
2. Facilitates Quick Insights
In a world where time is of the essence, data visualization allows for rapid analysis. Stakeholders can quickly interpret large volumes of data through visual formats, enabling faster decision-making processes. This is particularly beneficial in fields like medical research, where timely insights can lead to critical interventions.
3. Engages the Audience
Visual content is more engaging than text-heavy reports. With the use of colors, shapes, and interactive elements, data visualization captures the audience's attention and keeps them interested in the findings. This engagement is vital for effectively communicating research to both academic and non-academic audiences.
4. Supports Storytelling
Good research tells a story, and data visualization is a powerful tool for narrative-building. By creating a visual narrative, researchers can guide their audience through the data, illustrating the significance of their findings and the implications for future research or policy. This storytelling aspect can make the research more relatable and impactful.
5. Improves Retention of Information
Visuals are often easier to remember than text alone. Studies have shown that people are more likely to recall information presented visually. By incorporating data visualization into research presentations, researchers can enhance retention rates, ensuring that key findings are remembered long after the presentation is over.
Conclusion
Data visualization is not just a supplementary tool; it is a fundamental aspect of effectively presenting research findings. By enhancing understanding, facilitating quick insights, engaging the audience, supporting storytelling, and improving information retention, data visualization can significantly elevate the impact of research. Researchers are encouraged to embrace this powerful medium to communicate their findings more effectively.